The work, in perspective
Questions explored.
Ideas brought to life.
Data analytics is my main focus. Alongside it, I explore machine learning and build digital experiences with AI-assisted development.
One curiosity.
Evidence & imagination.01 / Core discipline
Data &
business insight.
Service operations, marketplace performance, lending processes and customer studies. Each project presents a concrete outcome and a source-grounded interactive dashboard.01 — Public-service operations analytics
CivicPulse
Business question
Where is reported service demand concentrated, and which unresolved requests or long resolutions deserve investigation?
Approach
Python preserves source exceptions, MySQL independently checks every agency and intake day, Excel reconciles totals, and five Power BI pages support operational review.
Technologies
Python, Pandas, MySQL, Excel, Power BI, DAX
A complete January 2025 cohort of 348,180 NYC 311 requests connects agency workload, resolution distributions and 1,640 requests still unclosed at the retrieval snapshot.
January 2025 intake; status observed 25 October 2026. Backlog belongs to this cohort. Due-date evidence covers only 1,295 eligible DSNY records; it is not a citywide SLA measure.
02 — Marketplace commerce & fulfillment
NovaMart
Business question
Where does the marketplace generate delivered item value, and which delivery patterns deserve investigation?
Approach
Python aggregates items, payments and reviews to their correct grain; MySQL independently reconciles the analysis, Excel validates the controls, and five Power BI pages support investigation.
Technologies
Python, Pandas, MySQL, Excel, Power BI, DAX
An analysis of 99,441 Olist orders connects BRL 13.22 million in delivered item value with delivery reliability, seller and category performance, and repeat purchases.
Historical Brazilian marketplace data in BRL. Item value is a GMV proxy, not revenue or profit. Delivery rates exclude eight delivered orders without actual delivery dates; timestamp and calendar-date lateness differ.
03 — Business analysis & process investigation
LoanFlow
Business question
Which lending-process patterns deserve case review, and do the modeled pilot assumptions justify the implementation cost?
Approach
Python extracts case and path metrics from the BPI Challenge 2017 event log; MySQL reconciles them, Excel validates formulas, and Power BI links cohorts to case histories and scenarios.
Technologies
Python, Pandas, MySQL, Excel, Power BI, Business Analysis
An investigation of 31,509 loan applications connects resolution time, repeated completed work and process variation to a transparent pilot decision exercise.
Calendar gaps are not proven queue time. Repeated work is an investigation proxy; scenario capacity value is hypothetical, not achieved savings.
04 — Job market & information quality
Job Market Quality
Business question
How clearly do postings describe pay and requirements, and how much does repeated text inflate observation counts?
Approach
Python prepares a dimensional model with transparent review rules; MySQL reconciles the counts, Excel supports review, and Power BI presents the evidence.
Technologies
Python, Pandas, MySQL, Excel, Power BI, DAX
A historical LinkedIn snapshot of 123,849 posting observations reveals pay disclosure, experience expectations and exact text repetition across 119,041 text groups.
March–April 2024 historical information quality; not a validated fake-job detector or a measure of today's vacancies.
05 — Retail intelligence
RetailIQ
Business question
Who buys, what do they buy together, and which customer patterns deserve attention?
Approach
Python notebooks prepare and analyse Online Retail, mall-customer, and Instacart data; MySQL scripts model and query it for a Power BI reporting layer.
Technologies
Python, Pandas, MySQL, SQL, Power BI, RFM, Cohorts, Apriori
Three independent retail studies cover customer value, product affinity, retention, mall personas, and grocery reorder patterns.
The website follows the seven-page Power BI report’s analytical scope, with verified aggregates and corrections for customer counts and visual aggregations. The three source populations are independent.
06 — Customer value & retention
ShopLens Analytics
Business question
Which customers are becoming inactive, and when do shoppers stop returning?
Approach
Python cleaning and exploratory analysis feed a SQLite star schema, then RFM, churn, and cohort scripts produce decision-ready tables for SQL and Power BI.
Technologies
Python, Pandas, SQLite, SQL, Power BI, RFM, Cohorts
An e-commerce analysis focused on finding valuable customer segments, spotting churn risk, and reading retention over time.
Uses the Online Retail II transaction dataset; data preparation and dashboard stages are described in the repository.
07 — Customer analytics
Customer Shopping Behaviour
Business question
How do customer and shopping attributes relate to product and loyalty patterns?
Approach
A documented Python cleaning and EDA workflow leads into statistical analysis, business-focused SQL queries, and a Power BI KPI dashboard.
Technologies
Python, Pandas, NumPy, SciPy, SQL, Power BI
A shopper-level study of purchase patterns across demographics, product categories, seasons, subscriptions, and delivery choices.
The supplied file contains 3,900 customer records and has no dated transaction column.
02 / Supply chain & operations
Flows, capacity
and reliability.
Freight-network planning and airline operations, with complete source populations, explicit denominators and clear limits on forecast and capacity claims.01 — Supply chain & freight planning
FreightFlow
Business question
Which regional freight flows deserve capacity review after considering baseline volume, forecast growth and economic density?
Approach
Python and DuckDB aggregate source detail without discarding repeated keys; MySQL reconciles 27 totals, Excel reviews a shortlist, and Power BI explores the full eligible population.
Technologies
Python, DuckDB, Pandas, MySQL, Excel, Power BI
A full FAF5.7.1 analysis transforms 2.67 million source records into a governed freight model and identifies 2,031 lane-trade candidates for further capacity investigation.
2024 is a baseline estimate; 2030/2050 are FAF source forecasts. Global lane scores are screening aids, not proof of capacity shortages, optimization or achieved savings.
02 — Airline operations & disruption analytics
AirOps
Business question
Which carriers, routes and departure patterns warrant investigation after checking eligible outcomes and observation volume?
Approach
Python retains lineage and missing outcomes, MySQL independently reconciles the metrics, Excel validates a sample, and Power BI supports operational comparisons and route investigation.
Technologies
Python, Pandas, MySQL, Excel, Power BI, DAX
A full-population analysis of 5,819,079 US flight observations compares arrival reliability, cancellations, route and airport patterns, and recorded delay attribution.
Historical 2015 records; custom on-time boundary ≤15 minutes. October numeric airport identifiers are unresolved and preserved.
03 / Applied machine learning
Models with
a purpose.
Time-aware forecasting, capacity-constrained churn ranking and computer vision. Held-out results, repository-reported metrics and hypothetical scenarios are labelled explicitly.01 — Time-aware demand forecasting
MobilityDemand
Business question
Can a time-aware model improve hourly rental estimates, and what does an assumed capacity buffer trade off?
Approach
Exact-clock historical lags preserve missing hours. Chronological train/validation/test periods separate fitting, model selection and evaluation; saved predictions and capacity arithmetic are independently checked.
Technologies
Python, Pandas, scikit-learn, SQL, Jupyter, Time-series evaluation
An hourly bike-sharing forecast compares gradient boosting with a same-hour-last-week baseline, then explores a transparent shortage-versus-excess capacity exercise.
Historical one-hour-ahead replay on 2,101 eligible test hours. Observed weather and target components are excluded. Capacity costs use arbitrary teaching units; this is not station-level fleet planning or measured savings.
02 — Churn propensity & campaign ranking
CampaignLift
Business question
How many observed churners can a ranked contact list concentrate within a strict 20% campaign capacity?
Approach
Four notebooks validate the attributed source, keep matching predictor profiles together, select the model on validation, reload it for scoring and inspect PSI drift.
Technologies
Python, Pandas, scikit-learn, Jupyter, Ranking metrics, PSI
A profile-grouped churn study compares two models and builds a capacity-limited retention review list from 3,150 historical telecom records.
Saved held-out predictions independently reconciled: 468 test customers, 93 contact slots and 60 observed churners captured. Ranking lift is not measured treatment uplift or achieved retention savings. No live prediction API.
03 — Applied machine learning · telecom churn
RetainAI
Business question
Which customers have higher churn risk, and how should a limited contact capacity be ranked under explicit campaign assumptions?
Approach
Four notebooks prepare profile-grouped splits, compare logistic regression with calibrated histogram gradient boosting, score a batch and inspect PSI drift. Identical predictor profiles stay together during splitting and calibration.
Technologies
Python, Pandas, scikit-learn, Jupyter, Calibration, PSI
An offline churn study on 3,150 anonymous telecom records compares two models, ranks a campaign contact list and checks distribution drift.
GitHub reference run: test average precision 0.8978 and ROC-AUC 0.9807. Repository-reported results; campaign benefits are hypothetical, with no deployed prediction service or measured retention uplift.
04 — Computer vision
Face Mask Detection
Business question
Can a lightweight image classifier distinguish masked from unmasked faces in a camera frame?
Approach
OpenCV's SSD / ResNet-10 face detector supplies face crops to a fine-tuned MobileNetV2 classifier with data augmentation.
Technologies
Python, TensorFlow, Keras, MobileNetV2, OpenCV, scikit-learn
A live webcam pipeline that locates faces, classifies mask status, and displays a confidence score beside each detection.
The README reports about 98% validation accuracy; this is a repository-reported result, not an independent benchmark.
04 / Product engineering
Useful ideas,
made tangible.
AI-assisted software work is labelled clearly and kept distinct from the self-authored analytics and machine-learning projects.01 — AI-assisted full-stack build
ReviewPilot AI
Business question
How can fast, deterministic checks and language-aware AI review work together on a pull request?
Approach
A FastAPI service accepts a pasted pull request URL or signed GitHub webhook, filters and prepares diffs, combines static checks with OpenAI review, then presents findings in a React dashboard.
Technologies
FastAPI, Python, React, TypeScript, OpenAI, Docker
A developer tool concept that turns pull request changes into structured, prioritised code review findings.
An AI-assisted software project, presented separately from the independently built analytics and machine-learning work.
05 / Interface work
Digital
experiences.
Selected storefronts, studios, and product interfaces. Each project links to its live site; repository descriptions remain focused on the user-facing work.01 — Commerce / Food
Live siteScotia Delights
Design focus
Commerce storytelling, responsive product presentation, and a direct path from browsing to enquiry.
Role
Web design & frontend
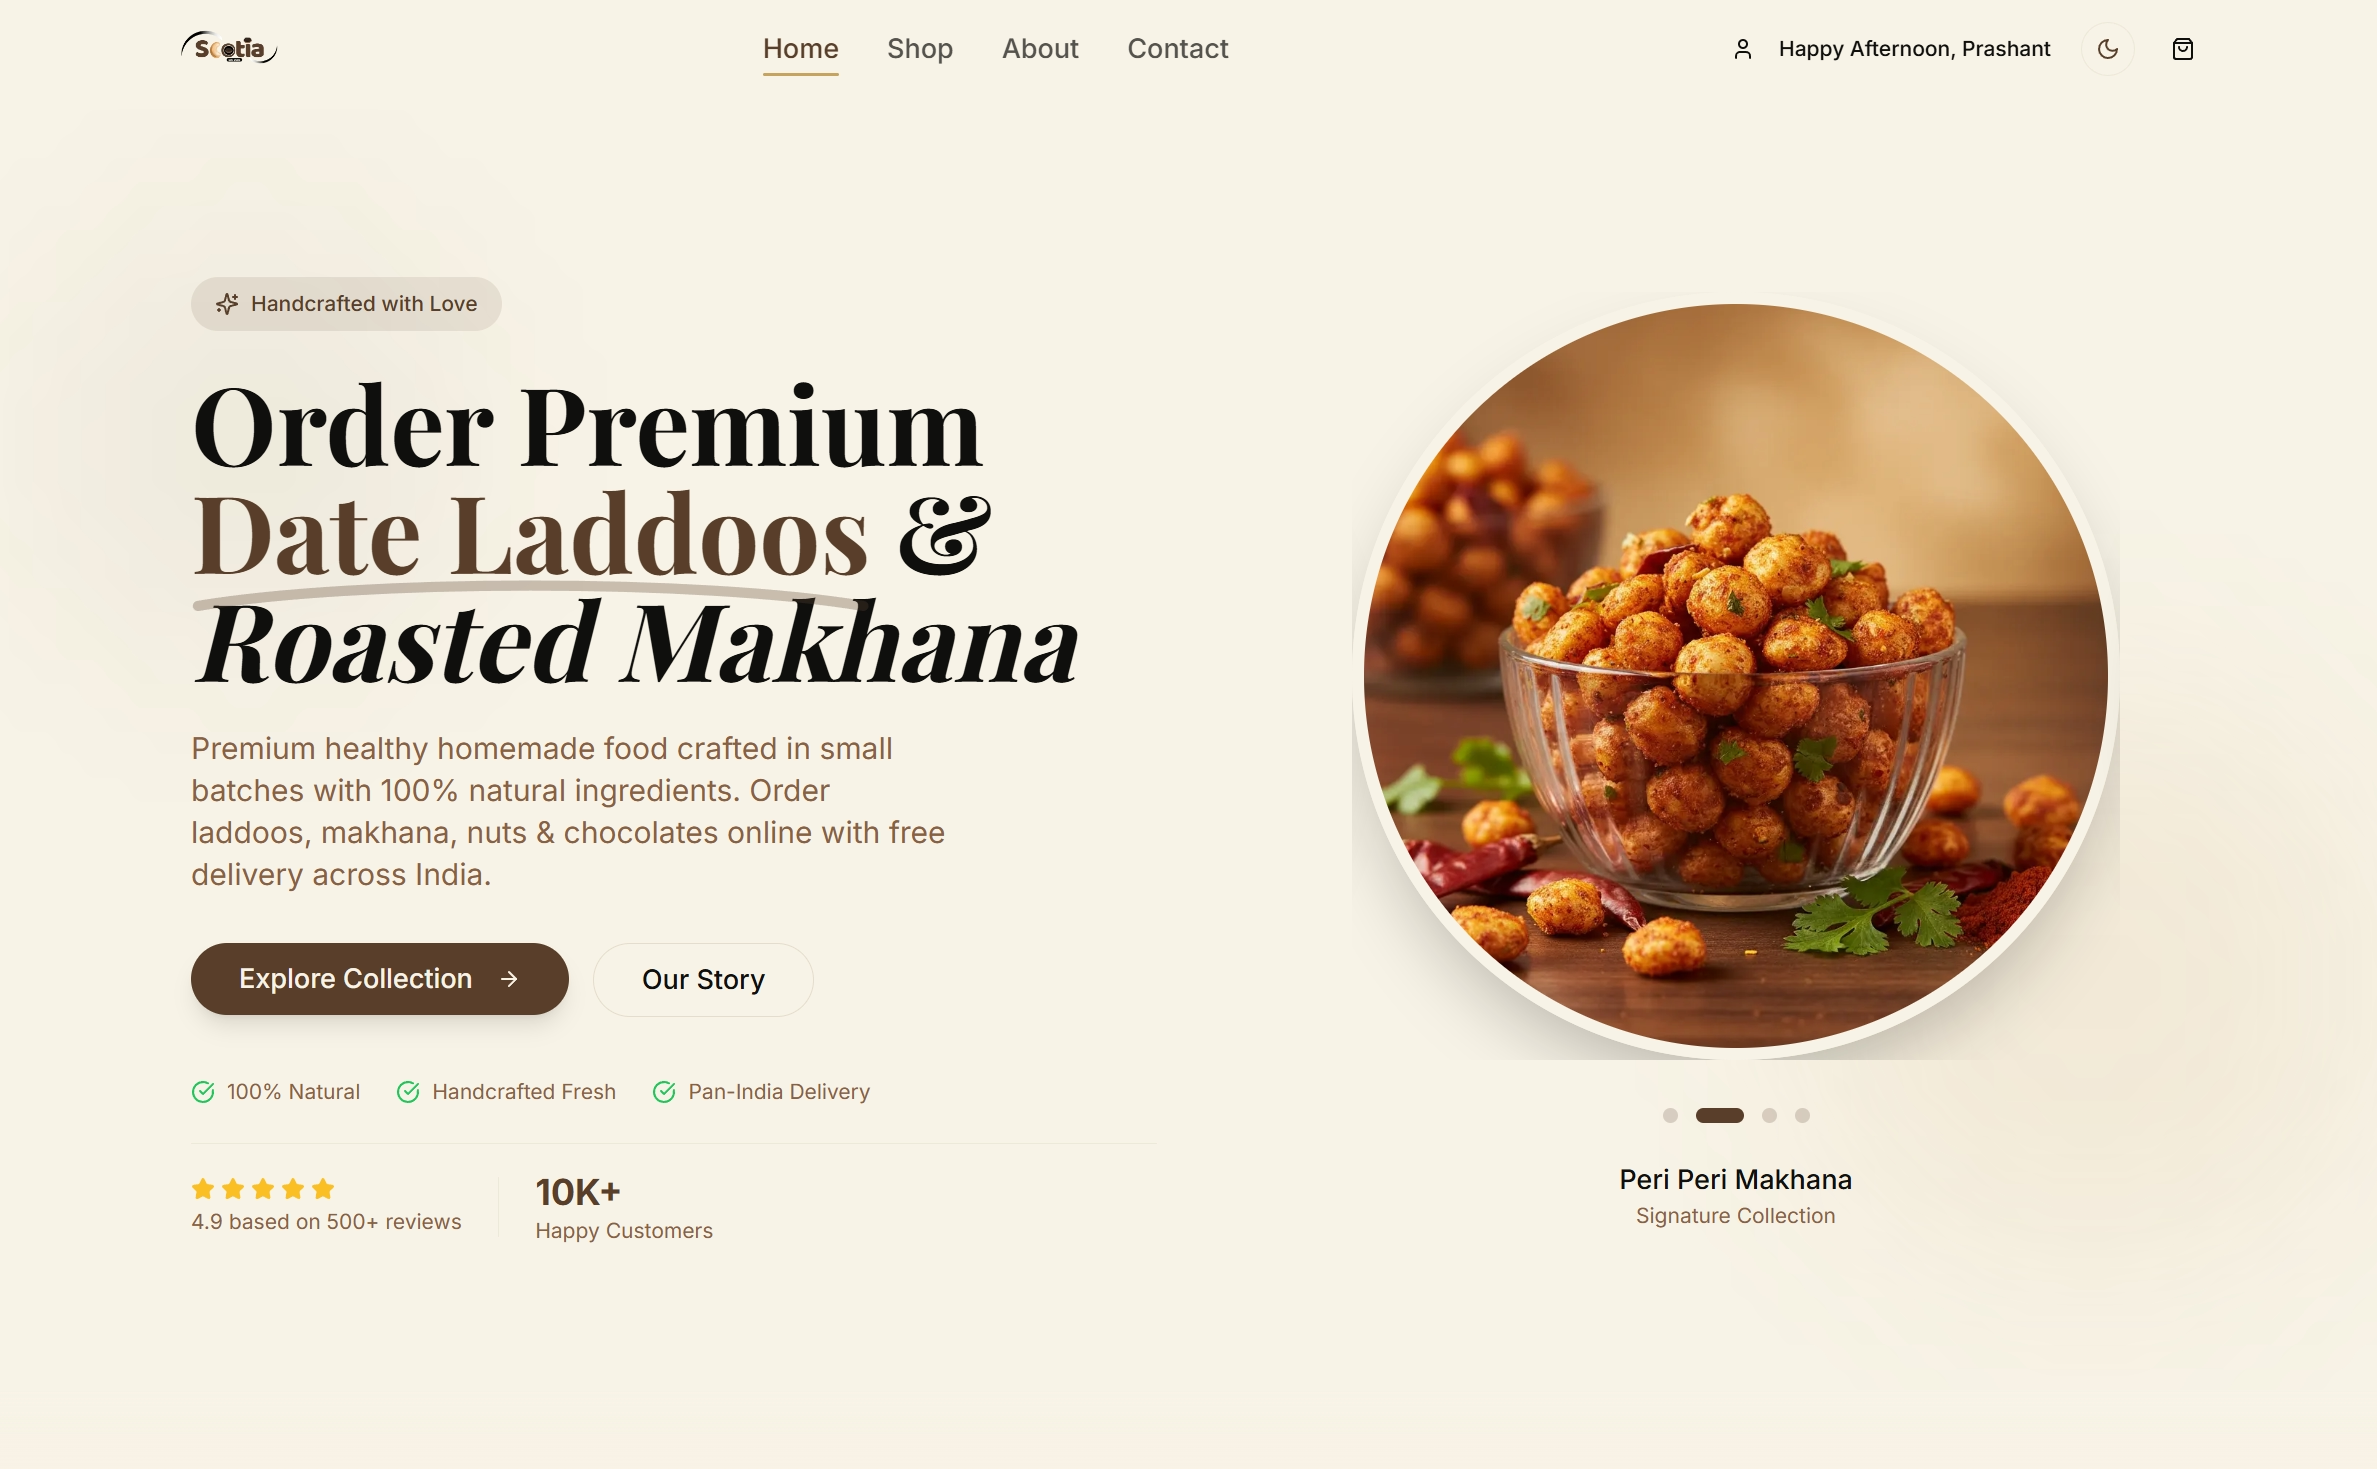
A premium bakery and hamper storefront shaped around product discovery, gifting clarity, and a fast mobile buying path.
Next.js, TypeScript, Motion
02 — Luxury / Editorial
Live siteLuxar
Design focus
A luxury visual system that keeps the product—not the interface—at the centre of the experience.
Role
Art direction & interaction
A high-contrast interior product experience with cinematic pacing, editorial type, and image-led storytelling.
Next.js, TypeScript, GSAP

03 — Industry / Environment
Live siteHortic
Design focus
Information architecture, responsive composition, and a credible technical-organic brand language.
Role
Brand system & web
A modern horticulture presence balancing practical industry communication with a fresh visual identity.
React, TypeScript, Tailwind CSS

04 — Studio / Portfolio
Live siteInterior Design LA
Design focus
High-resolution image delivery, mobile galleries, and a presentation system suited to spatial work.
Role
Visual design & frontend
A visual-first studio site with immersive project imagery, refined contrast, and an editorial portfolio rhythm.
React, CSS Grid, Motion

05 — Architecture / Services
Live siteRS Staging
Design focus
Responsive galleries, service clarity, and visual pacing for a high-consideration business.
Role
Portfolio design & build
A restrained staging portfolio built around spatial imagery, clear services, and low-friction contact paths.
React, Responsive media, Netlify

06 — AI / SaaS
Live siteClean AI
Design focus
Feature hierarchy, developer-facing clarity, and a concise route to product understanding.
Role
Product narrative & UI
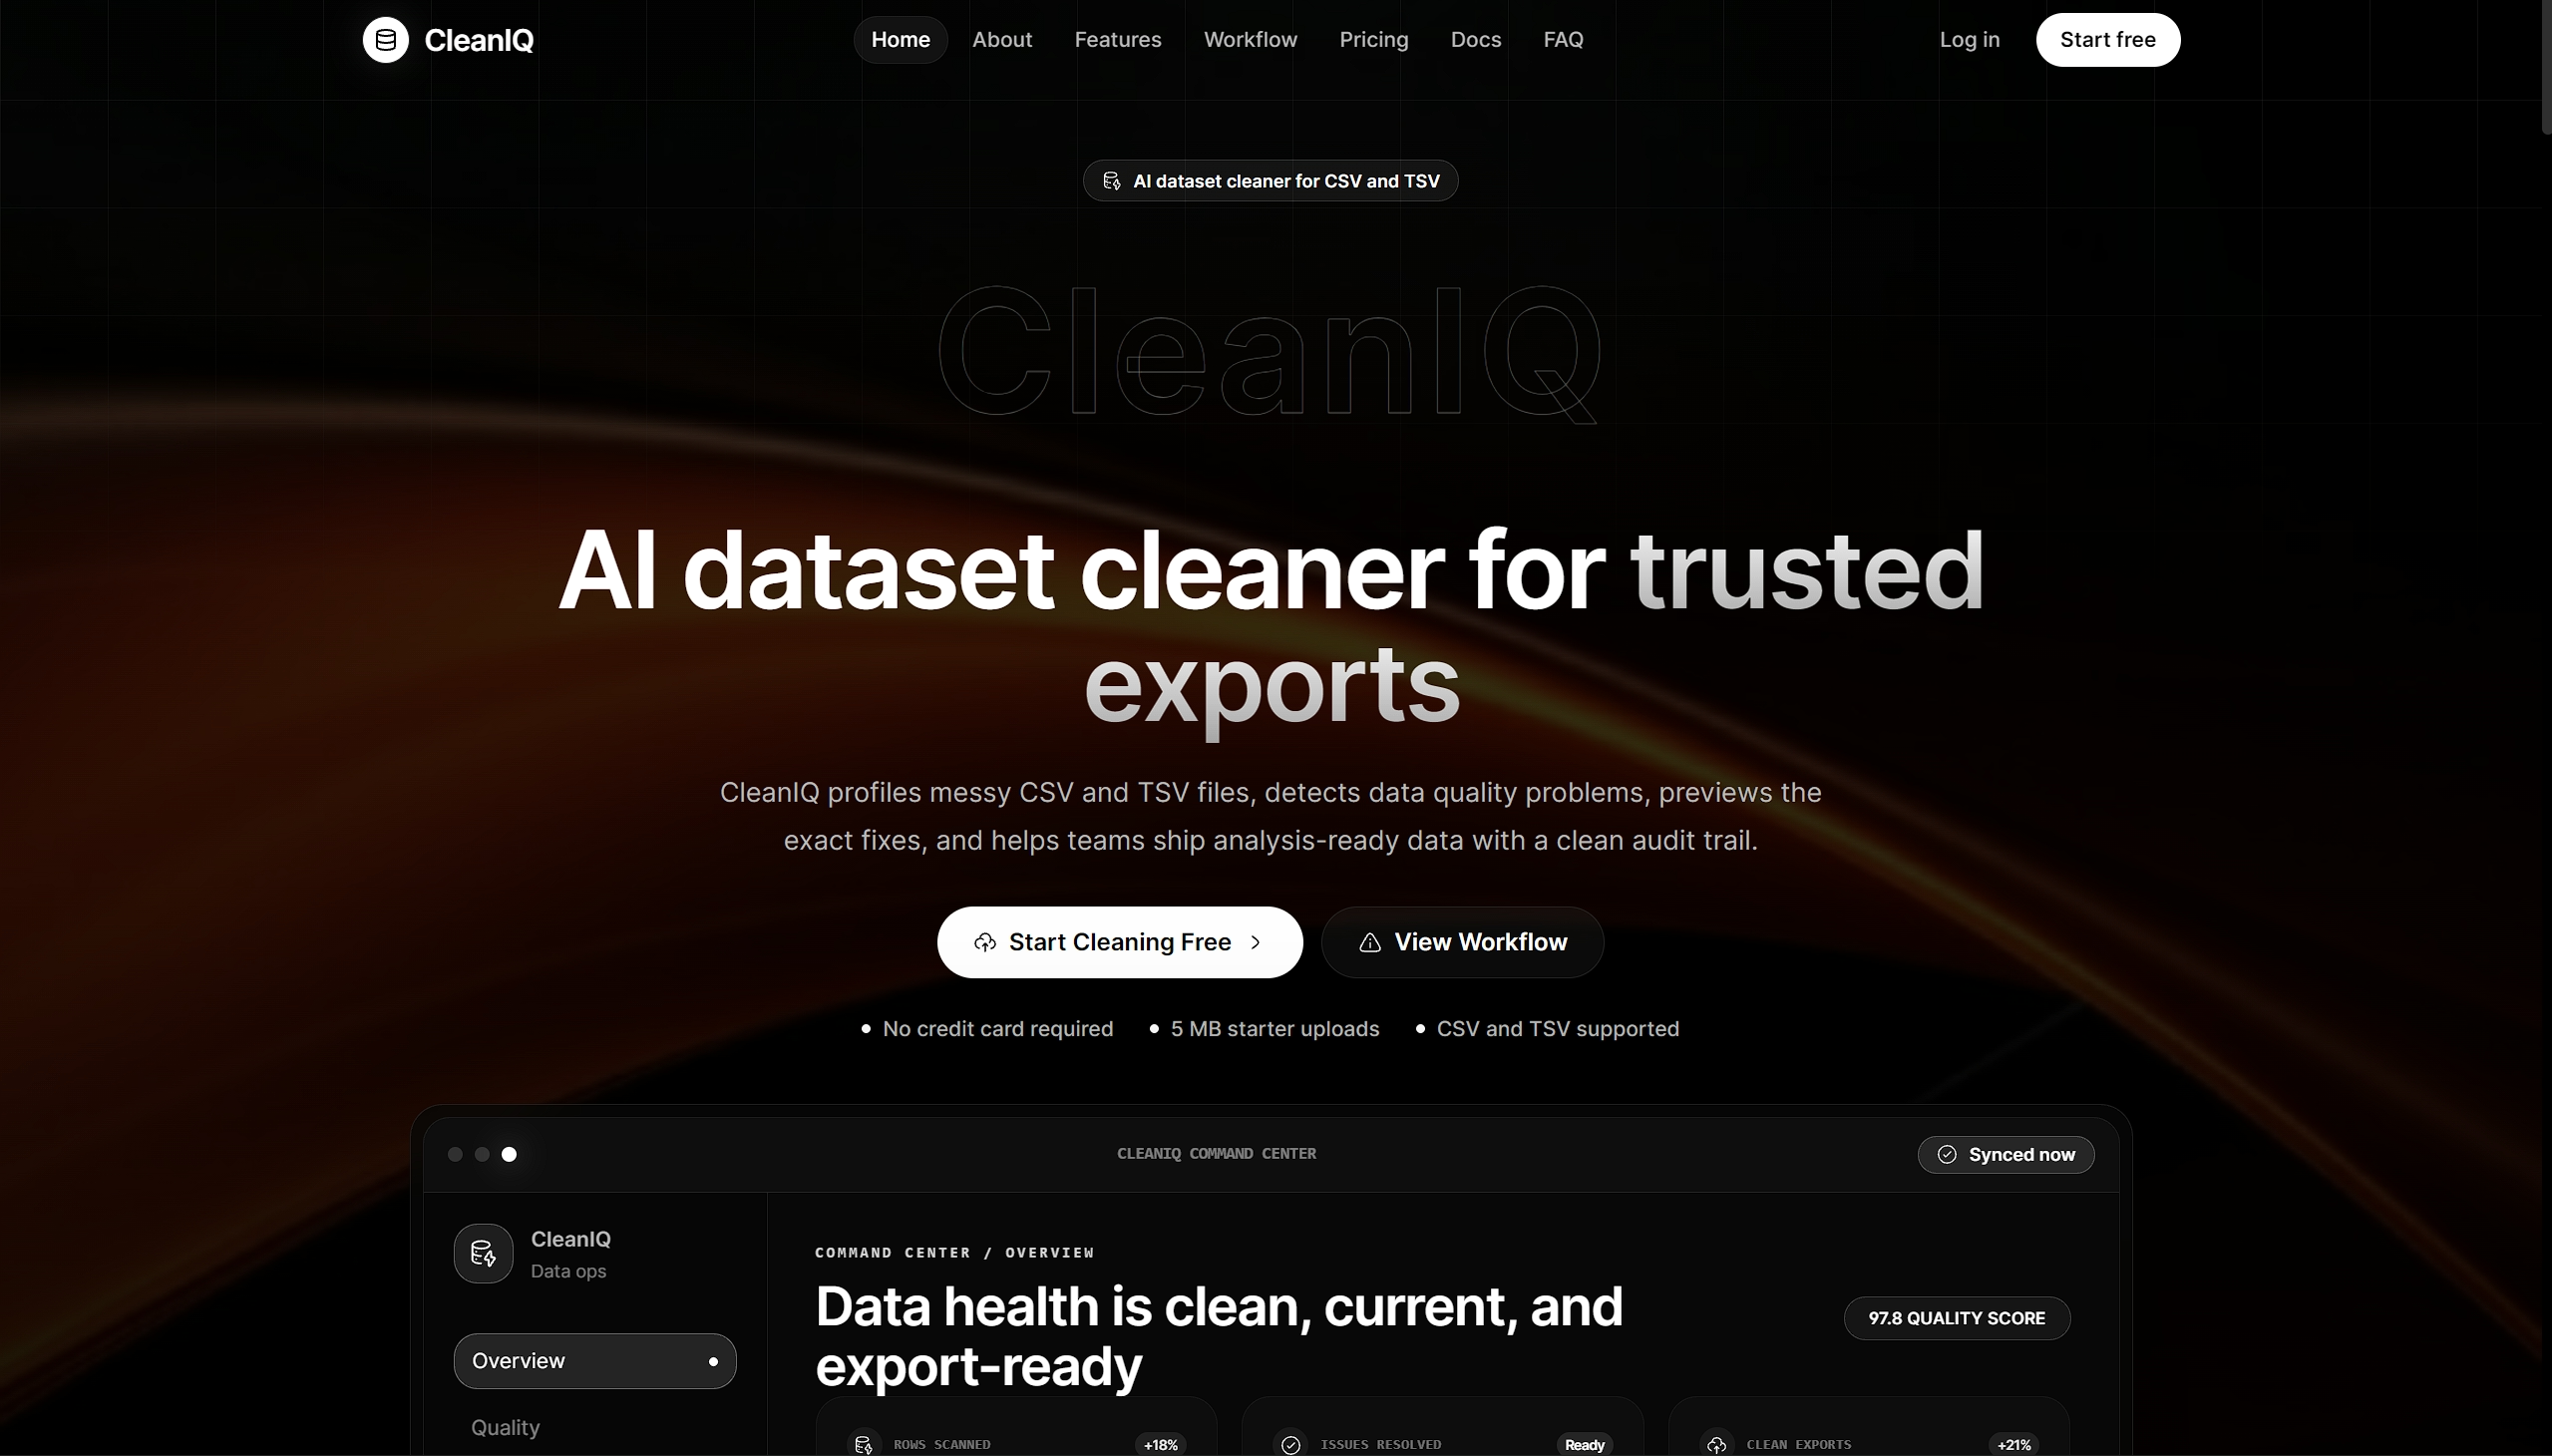
A technical product site that turns an abstract AI offer into a clear, credible, and navigable product story.
Next.js, React, TypeScript